Candlestick Pattern at Stockity
Learn how to read candlesticks and several basic patterns that traders often use to read market sentiment before opening a position.
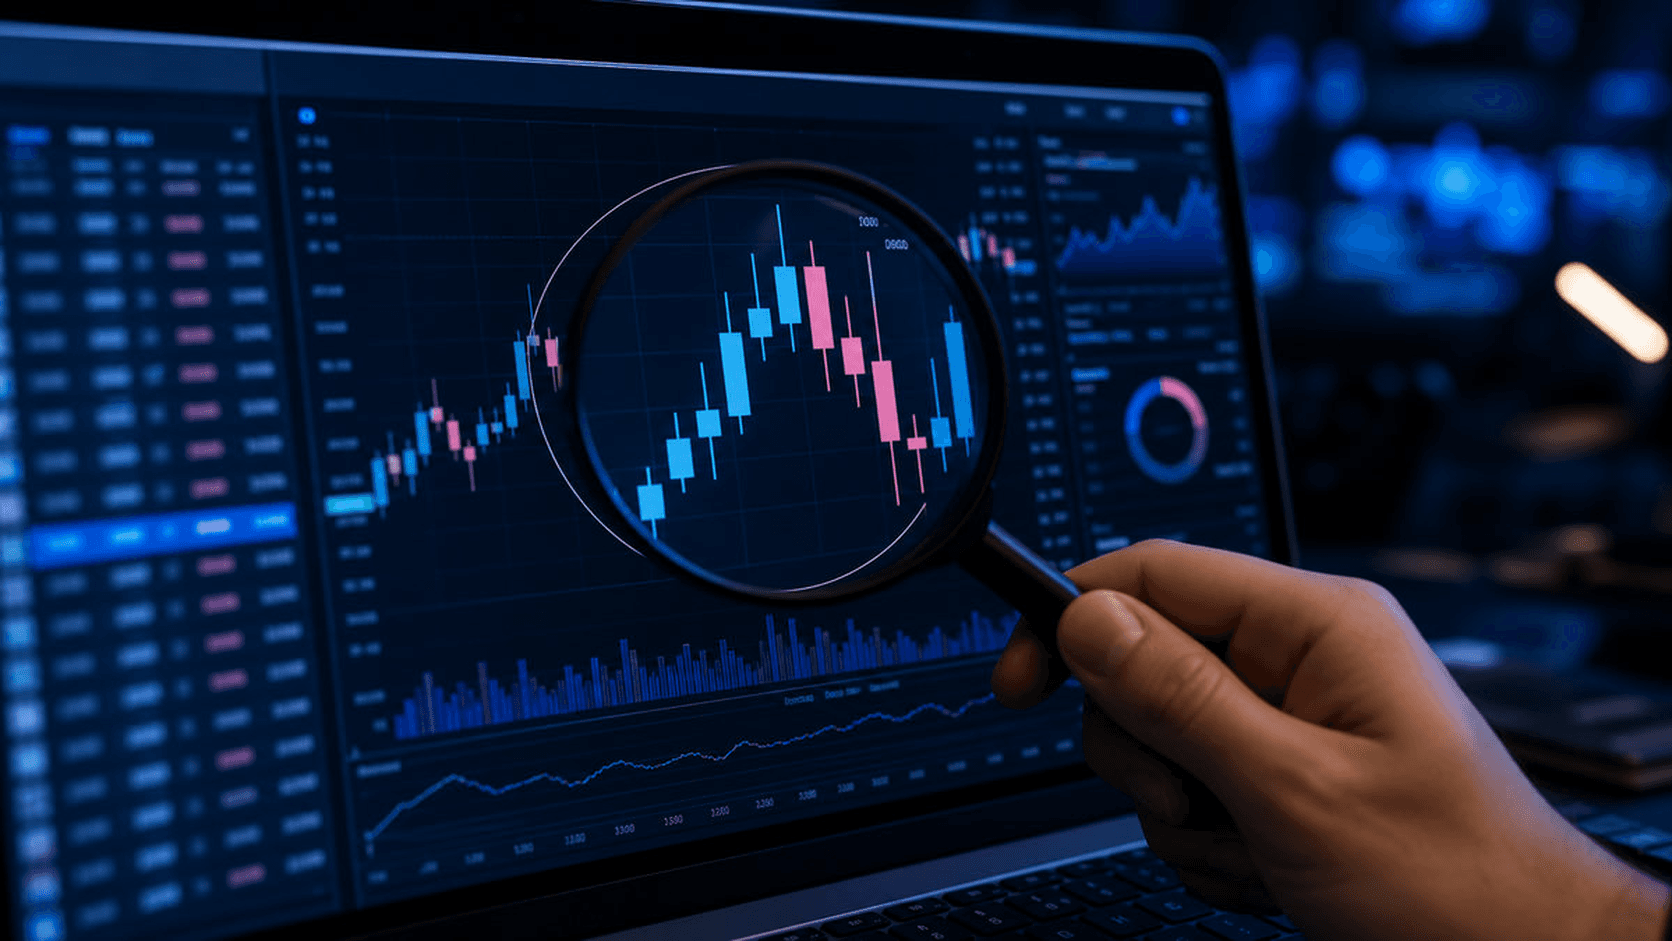
Candlesticks are one of the most common ways to read price movements on trading charts, including on platforms such as Stockity. This article discusses the basics of reading candlesticks and several patterns that traders often recognize.
Important: Online trading carries high risks, including the possibility of losing all funds used. This article is general educational in nature, not financial advice.
Anatomy of One Candlestick
Each candlestick represents price movements in a certain time period (for example 1 minute, 5 minutes or 1 hour), with four main elements:
- Open — opening price of the period.
- Close — closing price of the period.
- High — the highest price reached.
- Low — the lowest price reached.
The color of the candlestick body usually shows direction: green/blue for rising prices (close higher than open), red/pink for falling prices.
Several Basic Patterns that are Often Recognized
Doji
The candlestick body is very small or almost non-existent, indicating that the open and close prices are almost the same. Often interpreted as a sign of market doubt (indecision).
Hammer and Hanging Man
Small body with long lower axis. Appearing at the end of a downtrend is often called a hammer (potential upward reversal), while at the end of an uptrend it is called a hanging man (potential downward reversal).
Engulfing
A candlestick whose body "swallows" the body of the previous candlestick completely. Bullish engulfing appears after a downtrend, bearish engulfing appears after an uptrend.
How to Use Patterns Wisely
- Don't rely on one candlestick pattern alone — combine it with other indicators or the context of a larger trend.
- Patterns are more meaningful if they appear in relevant support/resistance areas, not just anywhere on the chart.
- Practice recognizing these patterns on a demo account Stockity before applying them with real funds.
- Remember that candlesticks depict what has already happened, not a guarantee of what will happen next.
Conclusion
Reading candlesticks is a basic skill that is useful for understanding market sentiment over a particular time period. But candlestick patterns are not definitive signals — always use them as one part of a broader analysis, not the sole basis for decision making.
Use funds you can truly afford to risk, and consider consulting an independent financial advisor before making any financial decisions. This article is educational in nature, not a guarantee of trading results.
Editorial Team Stockity Unofficial
Stockity Unofficial is an independent information portal and not the official Stockity website.